Table of Contents
Create a Sage CRM Dashboard in Less Than Five Minutes
How to add a Custom Filter to a Sage CRM Dashboard Gadget
How To Use Custom Pages As Sage CRM Dashboard Gadgets
How to Setup Customized Sage CRM Report Graphs
Get Advanced Sage CRM Dashboards with Dashboard Guru
Create a Sage CRM Sales Dashboard In Less Than 5 Minutes
Creating Sage CRM dashboards is easier than you might think. Yes, you can tailor your dashboards to show Saved Searches, Report Charts, do fancy drill down actions and add access to data from other websites.
Before you start going for the advanced functionality, use this guide to set up a basic sales dashboard out-of-the-box in Sage CRM (any version) in 5 minutes or less (you can always tweak it later):
- Login to Sage CRM
- Go to your MyCRM | Dashboard
- Click Classic Dashboard
- Select the “New Dashboard” icon
- Give your dashboard a name “Sales Dashboard” and set it to be your Default Dashboard.
- Click Continue.
- Click the Add symbol for the following items on the list:
- Chart: Team Oppos 28 day target
- My Opportunities
- My Opportunities Created This Week
- Recently Viewed Companies
- Opportunities Closing – This Quarter
- My Companies
- My Opportunities in Progress
- Saved Search Summaries
- Upcoming Appointments
- Upcoming Tasks
- Today
- Click Save.

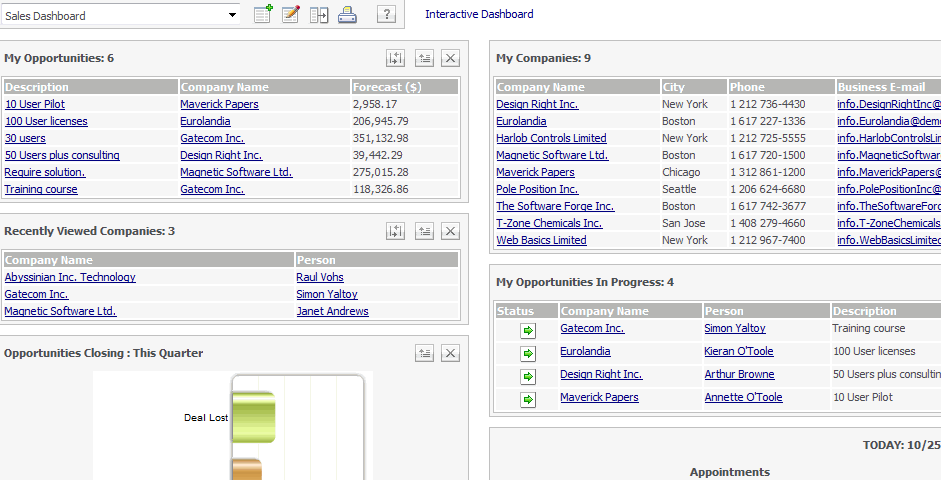
Your Newly Created Dashboard
It’s that easy!
Now you have your newly created dashboard, you can choose to remove certain elements that may not pertain to you by clicking on the Modify Dashboard button (the two buttons to the right of the New Dashboard button).
You can choose to remove or add other features to your dashboard and save it. Remember, dashboards update in real time every time the pages refreshes.
This is a great place to start your day in Sage CRM. It will help you work new leads, progress sales and, best of all, close them!
Return to Top
How to add a Custom Filter to a Sage CRM Dashboard Gadget
Since the inception of the Interactive Dashboard, Sage CRM has evolved with the current trend of reporting on demand. Now learn how to add a custom filter to a dashboard gadget in Sage CRM.
No longer are reporting needs satisfied by hours of data compilation and distribution. Today’s users can simply access data from predefined Dashboards that are as up-to-date with the underlying data. Sage CRM Dashboards consist of a number of report gadgets and data can be displayed using a number of different gadget types.
The simplest and most common gadget type is called a List gadget, where data can typically be filtered using any of the fields that are present within the gadget.
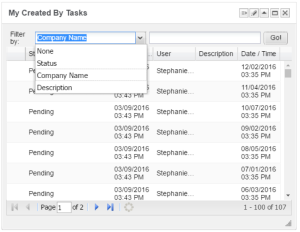
For example, using the example below, the 107 Communication records can be filtered down to a smaller list if the user chooses to Filter by, “Company Name” and then proceeds to enter a Company Name, followed by selecting the “Go” button.
There are a couple of exceptions to the above statement.
CRM fields that have a type of Search Select Advance or User Select are excluded from the filter. This can present a challenge with reporting using the Interactive Dashboard.
Using the above example, perhaps there is a business need to display a listing of all Pending Communications that the Current User created and assigned to other users. Adding the ability to display only records where the Created By {comm_createdby} equals the current user is not possible using the native tools within Sage CRM.
Let’s explore a work around to the above business need.
Setting up Your Filter
The root of all Dashboard Gadget and Reports within Sage CRM are MS SQL Database Queries. These queries can be copied and/or modified within Sage CRM to accommodate for the above challenge to the application.
Using the example below, we copy the logic defined in the vReportCommunication database view and saved it as vCommReport.
This approach allows us to experiment with a new database query without the risk of damaging other reports and/or gadgets that rely on the present integrity of the vReportCommunication query. [NOTE: BACKUP YOUR DATABASE BEFORE MAKING CHANGES TO VIEWS.]
As you can see from the example below, we have included an additional database join where we are linking the Users Tables to the Communications table (red highlight). This approach allows us to expose the First and Last Name of the User by adding an alias field called comm_cb (orange highlight).
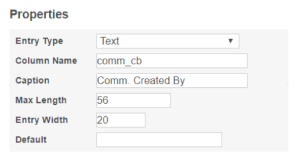
In addition, in order to utilize the alias field within the application, the field must be added to the entity within Sage CRM. In this situation, the comm_cp field was added to the Communication Entity as an Entry Type of Text.
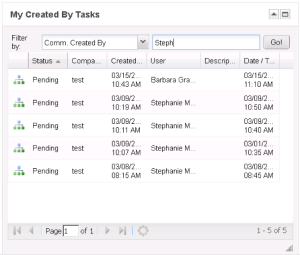
Finally, once the Comm. Created By {comm_cb} field has been added to the report contents, it will then be accessible as a “Filter by” field, within the report Gadget.
Note: the “Filter by” field within each report gadget will store the User Specified Preference. Using the example below, if a user enters “Steph” and then selects the “Go” button, CRM will always remember this preference and the gadget will remain with this setting for this user.
And there you have it – hopefully this workaround helps you get more from your Sage CRM Dashboards and Reports!
Return to Top
How To Use Custom Pages As Sage CRM Dashboard Gadgets
The Sage CRM Interactive Dashboard allows users to customize the layout enabling them to see, at a glance, important information that is aggregated into a single place.
Recently, we had a customer who wanted more than just lists and graphs. They wanted the ability to use a full search screen to filter a list and have the options they selected propagate several other gadgets on the screen.
What a fantastic idea, combine the power of the Interactive Dashboard with the functionality that drives Sage CRM.
There is one little problem though: Sage CRM doesn’t pass any session information to the gadgets preventing you from using a custom ASP page on the Interactive Dashboard.
But the Interactive Dashboard does allow you to add a URL to the webpage you want to load and the selected page gets loaded into an iFrame in the Interactive Dashboard. With this in mind, we need to create a “shim page” to grab the session information from the dashboard, get the desired path to the custom page from the query string and finally redirect to my custom page.
Step 1: Create The Shim
A shim page is simply a basic HTML page used to control outcomes. In this case, it’s going to be a simple HTML page that parses the query string of the website gadget as well as the query string of the Interactive Dashboard. This combines the information to construct a URL to redirect the user to.
The shim can be located anywhere under WWWRoot, however, in this example, we have saved the page under CustomPages/Ignite. The shim page requires that the path to the custom page is passed in on the query string using the name gadgetPath.
This page is mostly JavaScript with a simple call to the redirect function from the body onload function. Here is the JavaScript for the shim.
[sourcecode language='jscript']
function getQueryStringVal(name, string)
{
    // replace illegal characters from the name
    name = name.REPLACE(cast(cast(cast(cast(cast(cast(cast(cast(cast(cast(cast(cast(cast(cast(/[[]/ as nvarchar(max)) as nvarchar(max)) as nvarchar(max)) as nvarchar(max)) as nvarchar(max)) as nvarchar(max)) as nvarchar(max)) as nvarchar(max)) as nvarchar(max)) as nvarchar(max)) as nvarchar(max)) as nvarchar(max)) as nvarchar(max)) as nvarchar(max)),cast(cast(cast(cast(cast(cast(cast(cast(cast(cast(cast(cast(cast(cast( "\[").replace(/[]]/ as nvarchar(max)) as nvarchar(max)) as nvarchar(max)) as nvarchar(max)) as nvarchar(max)) as nvarchar(max)) as nvarchar(max)) as nvarchar(max)) as nvarchar(max)) as nvarchar(max)) as nvarchar(max)) as nvarchar(max)) as nvarchar(max)) as nvarchar(max)),cast(cast(cast(cast(cast(cast(cast(cast(cast(cast(cast(cast(cast(cast( "\]" as nvarchar(max as nvarchar(max as nvarchar(max as nvarchar(max as nvarchar(max as nvarchar(max as nvarchar(max as nvarchar(max as nvarchar(max as nvarchar(max as nvarchar(max as nvarchar(max as nvarchar(max as nvarchar(max)))))))))))))))))))))))))))));

    // construct the regex to find the value
    var regexS = "[\?&]" + name + "=([^&#]*)";
    // construct the regex object
    var regex = new RegExp(regexS);
    // get the results
    var results = regex.exec(string);
    // return the value
    if(results == null)
        return "";
    else
        return decodeURIComponent(results[1].replace(/+/g, " "));
}

function getParentQueryString(name)
{
    return getQueryStringVal(name, parent.location.search);
}

function getQueryString(name)
{
    return getQueryStringVal(name, self.location.search);
}

function redirect ()
{
    // Get the destination
    var destination = getQueryString("gadgetPath");
    // Get the protocol for the site
    var protocol = self.location.protocol;
    // Get the host
    var host = self.location.host;
    // Get the path information
    var path = self.location.pathname;
    // Parse the install name from the path information
    var InstallName = path.split('custompages')[0];
    // Get the Session ID from the parent (Interactive Dashboard)
    var SID = getParentQueryString("SID");
    // Construct the URL
    var Redir = protocol + '//' + host + InstallName + destination  + '?SID=' + SID
    // Redirect
    self.location = Redir;
}
[/sourcecode]
With the JavaScript in place the only thing left to do on the shim is call the redirect function when the page loads. To accomplish this, I simply call redirect from the body onload function.
[sourcecode language='jscript']
Please wait while you are redirected.
[/sourcecode]
Step 2: Create Your Custom Page
To keep things brief we’re going to use a quick and simple custom ASP page that loads a list of companies and renders that to the screen.
One important thing to note is the name and location of the page because you are going to need to pass that on the query string to the shim which is covered in the next step.
For this example, we created this page under WWRoot/CustomPages/Ignite and named it Test.asp. Here is the code from that page:
[sourcecode language='jscript']
var cont = CRM.getBlock("Container");
var lst = CRM.getBlock("CompanyGrid");
cont.DisplayButton(Button_Default) = false;
cont.AddBlock(lst);
eWare.AddContent(cont.Execute());
Response.Write(eWare.GetPage("NOTABS"));
[/sourcecode]
Step 3: Tie It All Together
Now that you have your shim and custom page built the only thing left to do is tie it all together.
This is accomplished by navigating to the Sage CRM Interactive Dashboard and selecting the specific dashboard you want to add your new gadget to or creating a new dashboard. Once you are on the Interactive Dashboard, you want to add your new gadget to follow these steps:
- Click Create Gadget from the New Gadget menu to open the Gadget Wizard.
- Scroll to the bottom of the list and select website.
- Enter the URL to the shim with the path to your custom page on the query string. In this example that will be ‘http://sagedemo/crm/custompages/Ignite/GadgetShim.asp?gadgetPath=CustomPages/Ignite/Test.asp’
- Click Next.
- Give your new gadget a name and description and click Finish.
You have now created a new gadget that loads a custom ASP page and has access to all the goodies Sage CRM has to offer.
Return to Top
How to Setup Customized Sage CRM Report Graphs
It is the end of the quarter and time for you to get ready for that big meeting with the boss. You need to provide him with reports but notice that the visual appeal falls a little flat. Have no fear as this article will provide you with the knowledge of how to customize Sage CRM Report graphs.
Find the FusionChart Folder
FusionCharts functionality has been added to Sage CRM since version 7.1 to improve the visual effect of graphs within Standard Sage CRM Reports, on the Interactive Dashboard, and when using Chart Blocks.
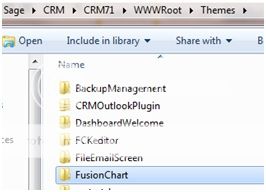
You can find the FusionChart folder in /Program Files/Sage/CRM/[installname]/WWWRoot/Themes/.
Change Background Color
When you open the FusionChart folder you will find three folders: color, default and neutral.
Let’s say that you want to change the background color of your charts. Open the color folder and select the color1.FSN file.
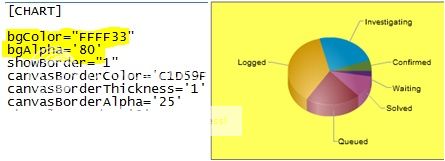
You need to open the file with text editor software, such as Notepad, to view the content. Find the “bgColor” line and replace the existing value with any hex color code that you want, but make sure not to include the # symbol.
You can also change the transparency of the background color by adding bgAlpha=”#”and entering in a numerical value for that ranges from 0 to 100. Save the FSN file and refresh your CRM screen when you are finished making changes to see the results of your work.
Add Values to Graph Labels
You can add numerical values to your graph labels as a way to make the data easier to read.
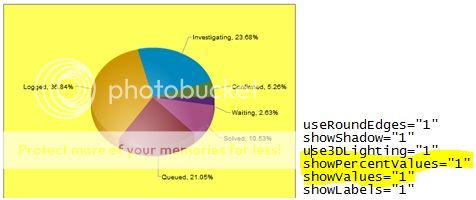
In the same document, find the showValues=”0” line, and change the value from “0” to “1”. Save your changes and refresh the screen to see numerical values on your graph labels.
Some graph data is better displayed as a percentage, a pie chart, for example. In order to change the values to percentages locate the line showPercentValues=”0” and change the value to “1”.
Save the changes and refresh the screen to see how your graph has improved.
Rotate Graph
Though you have added values and changed the background color to your graphs, you might still find that they are hard to read.
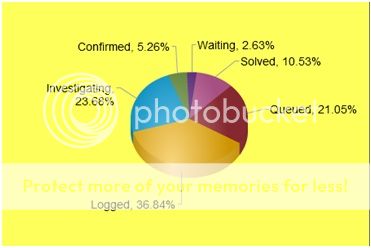
Another way to change the visual presentation is by rotating your graph to best display the data. You can do this by finding the enableRotation=”0″ line and changing the value from “0” to “1”.
Save your changes, refresh your screen and left-click and hold the cursor of your mouse on the graph to rotate the graph in the direction you move the mouse.
Summary
Remember, the FusionChart folder contains the files that allow you to modify graphs in CRM. You need to use a text editing software to make changes to the FSN files of the different color schemes a graph uses, save and then refresh your screen.
If you want to learn more about changes you can find information at http://www.fusioncharts.com/docs.
Enjoy creating visually stunning graphs that really hammer home the points to your boss and coworkers.
Return to Top
Get Advanced Sage CRM Dashboards with Dashboard Guru
If you need better reporting and analytics, take a look at the Dashboard Guru for Sage CRM
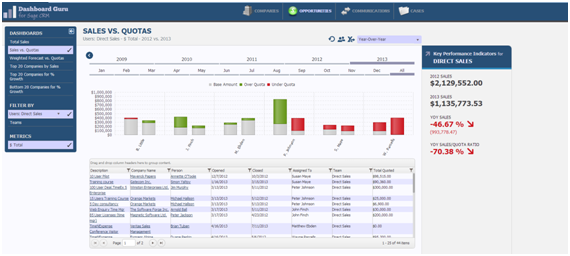
Dashboard Guru is a more robust business intelligence tool that works with Sage CRM. It goes beyond the interactive Sage CRM dashboards that come out-out-of-the-box and give you more options to visualize your data and see what’s working … and what’s not.
This advanced dashboard tool is designed to complement, not replace, the existing dashboards in Sage CRM.
<>Dashboard Guru works in real time to help you identify trends and issues that could be dragging your team’s performance down. It allows you to aggregate information from multiple data sources – your ERP, data warehouse, CRM or other data source.
What really makes Dashboard Guru stand out is its ability to let users do additional and specific analysis on what they see in the dashboards and then bring those findings back to Sage CRM so action can be taken.
With just one click, Dashboard Guru exports the dashboard information right to excel for further analysis.
Even more important is the ability for you to take action on what you have seen and analyzed. Again, with a single mouse click on the “Grouping” icon you can create a static group in Sage CRM.
This provides you with a contacts list for you to follow-up with the companies and people that make up the dashboard data.
Imagine that you sell a product that needs follow up every 90 days. With Dashboard Guru you can have a dashboard created for you by the team at Azamba that would pull all the sales of that product from your ERP.
Then, you would be able to create a group in Sage CRM that would show you the most recent customers that need contact. Refresh the dashboard and re-save the group and you have a new list of customers to contact. No more asking for advanced SQL queries from your IT people and then trying to import data back into Sage CRM.
The best part? You never left Sage CRM to do any of this.
Data security is always a concern when dealing with business intelligence tools. The Dashboard Guru has been designed to follow the Sage CRM security model.
This means if your user’s Sage CRM profile does not allow them to view or access certain data, they will not be able to see or access that information through the Dashboard Guru.
One of the most important features of any dashboarding tool is its flexibility. Dashboards need to be customizable because people like to view their information in many different ways.
Dashboard Guru is extremely flexible and has various filters and chart options which can be configured to allow information to be sorted and presented in many different ways.
Make sure you don’t miss out on the value that the Dashboard Guru can deliver to you and your team. It can quickly transform your data from a collection of information just sitting in various applications and computers to a significant and valuable company asset.
To find out more click here.

